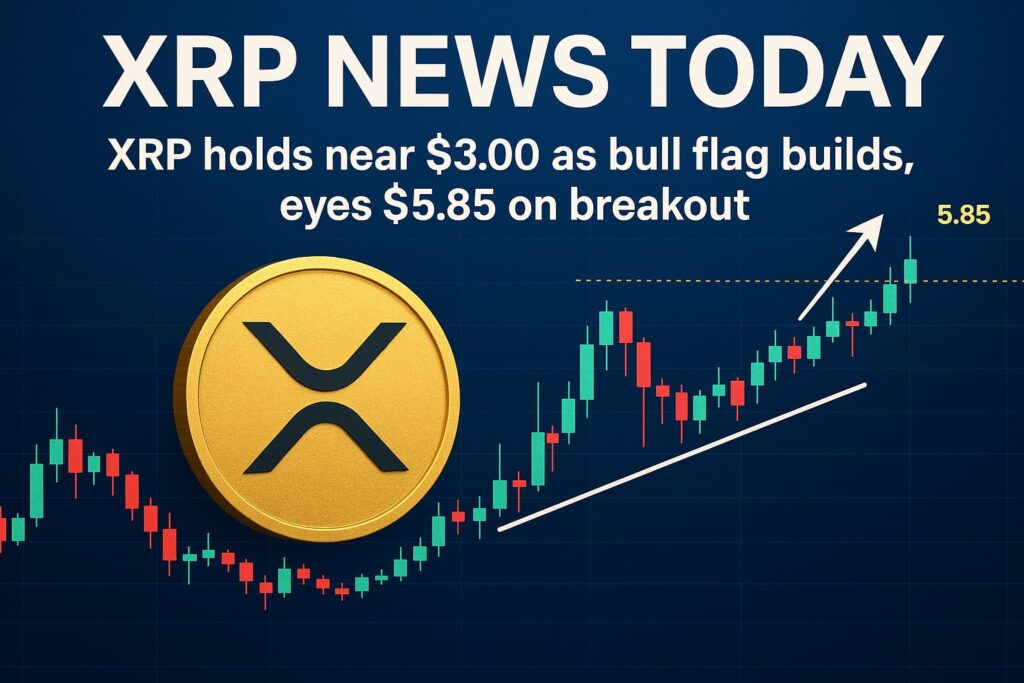
XRP is holding close to the $3 mark and moving in a tight range. Traders are watching this coil because it looks like a bull flag, which is a pause during an uptrend. If price breaks the top of the range with strong volume, chart watchers point to $5.85 as a common target. The idea is simple. A strong run creates the “flagpole,” price rests in a tight channel, then a breakout repeats a good part of the first move. That is why the $5.85 number keeps popping up in talk around XRP news today.
The $3 area matters a lot right now. Dips toward $2.97 to $3.05 keep finding buyers, so that band acts like support. Rallies toward $3.08 to $3.30 keep slowing down, so that band acts like resistance. Price sitting in the middle of these zones tells you the market is loading up energy. A daily close above the top end of the box would show buyers in control. A daily close under the bottom shelf would warn that the setup needs more time.
Let’s break the bull flag idea into plain words. First, there is a sharp push up. Next, price drifts lower or sideways inside two lines that look like a small channel. Think of it like catching your breath after a sprint. If buyers step in and push the price above the top line of that small channel, the move often continues. Traders then measure the height of the flagpole and project it from the breakout point. That is how targets like $4.44 and $5.85 are built. It is not magic. It is a simple measuring trick that many chart users follow.
Now, what would a clean breakout look like for XRP? Strong candles closing above $3.30 to $3.33, rising volume, and follow-through the next day. After that, price often retests the breakout area. If the retest holds and buyers step in again, the path opens toward the next zones. In this case, that means $3.60 to $3.80 first, then the mid $4s, and later the $5 handle where $5.85 sits as a stretch level. These are steps on a staircase. Price climbs, rests, climbs again.
What could go wrong? If XRP loses the $3 shelf and closes under recent lows, the flag picture weakens. That kind of move could send price into the high $2.80s, where buyers would need to show up again. A fake breakout is another risk. Price can poke above the range, stall, and slip back inside. That trap is common in tight markets. Many traders wait for a daily close and a retest so they do not chase the first spike.
A quick word on mindset. A setup is just a plan, not a promise. The bull flag gives you a map. It does not give you certainty. Good maps mark both the green lights and the red lights. For XRP right now, green lights sit above $3.30 to $3.33 with strong volume and steady follow-through. Red lights sit under $2.97 to $3.00 with weak bounces and heavy selling on rallies. Watching how price reacts at these lines tells you the next likely swing.
Why are many traders focused on $5.85? It lines up with that measured move idea and with past areas where price paused. When a target lines up with more than one method, it tends to get more attention. Attention can feed on itself because more orders cluster around the same levels. That does not make the move certain, but it does make the level worth tracking.
Here are the levels in one place. Support sits around $2.97 to $3.05. Resistance sits around $3.08 to $3.30. Breakout confirmation sits above $3.30 to $3.33 on a daily close. If that happens, the path many traders sketch goes to $3.60 to $3.80, then toward $4.44, and later toward $5.85 if momentum stays strong. If price slips under $3 and cannot get back fast, focus shifts to $2.88 to $2.92.
FAQs
A calm pullback in a tight channel after a strong rally. A push above the channel top often starts the next leg higher.
It is a chart-based level made from the measured move of the flagpole. It becomes more relevant only if price breaks and holds above $3.30 to $3.33 with strong volume.
Daily closes, volume, and the strength of any retest near the breakout line. Clean break, steady follow-through, and higher lows are good signs. Sharp rejections and weak bounces are warning signs.
Also read:


